
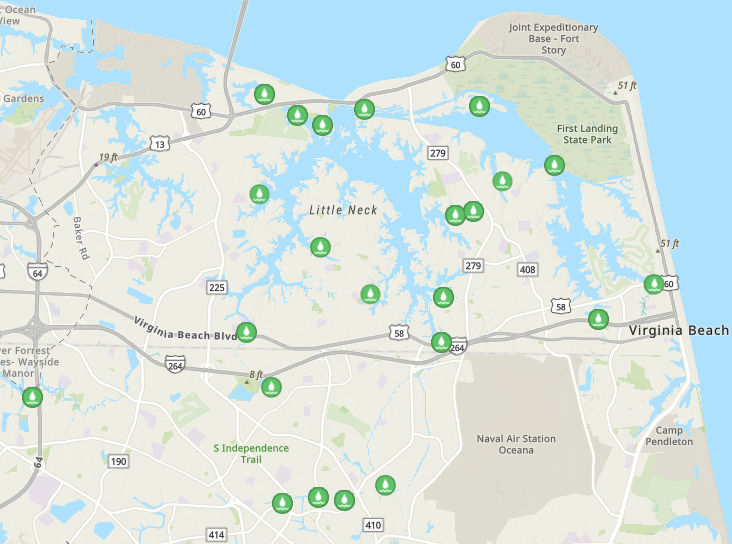
Community volunteers can help Lynnhaven River Now keep an eye on Virginia Beach waterways by becoming Water Quality Monitors. In partnership with HRSD, water samples from locations around Virginia Beach with a concentration in the Lynnhaven River Watershed are tested for nutrients and contamination on a monthly basis. Our community scientists collect water samples, gather site data, and deliver the samples to HRSD for processing on the first Tuesday or second Monday of each month. The results and site data from the monitors are collated at LRNow and shared with volunteers and the public.
Spots are limited in the HRSD testing program and we don’t currently have any openings. If you would like to be added to the waitlist, please complete this form. If you have an area of concern or proposed testing site please e-mail Cristin.
Results are available starting from 2015. The data is currently sorted by date, if you are looking for a specific waterway click the link and use the filtering option in the top row. Review the 2025 Year End Report
Water Quality Thresholds
The Virginia Department of Environmental Quality (DEQ) uses enterococcus and E. coli testing to determine whether a waterbody is safe enough to support primary contact activities such as swimming. The Virginia Department of Health continues to monitor fecal coliform when recommending shellfish eating advisories. Per VA DEQ:
- Enterococcus (Salt or Brackish Water) 35 per 100ml (Geometric Mean over 90 Days)
- Indicator of fecal contamination If the mean is exceeded more than once over a 90-day period the waterway is considered to be impaired for recreation.
- Coli (Freshwater) 126 per 100ml (Geometric Mean over 90 Days)
- Indicator of fecal contamination; If the mean is exceeded more than once over a 90-day period the waterway is considered to be impaired for recreation.
- pH 6.5-8.5
- A basic parameter controlling water chemistry and aquatic health. Affects chemical and biological processes; organisms can only survive in specific range.
Per EPA – standards under review by VA DEQ
- Kjeldahl Nitrogen .5-20 mg/L
- Useful to evaluate contributions of organic nitrogen from wastewater treatment plants, manure, and other potential sources.
- Total Nitrogen 2-6 mg/L
- Excess nitrogen can be harmful to aquatic life by increasing growth of algae and aquatic vegetation and decreasing oxygen availability.
- Nitrate <10mg/L
- Valuable for monitoring the impacts of inputs such as agricultural and urban runoff, wastewater treatment plants, leaking sewage systems, industrial point sources, and other sources.
- Phosphorus <.1mg/L
- Essential for plant growth; necessary for metabolism and growth of aquatic organisms. Excess phosphorus can be harmful to aquatic life by increasing growth of algae and aquatic vegetation and decreasing oxygen availability.
- Turbidity >30 Secchi Tube reading
- An indicator of water transparency. Water may be more turbid (cloudy) if algae and aquatic plant growth increase in response to higher nutrient concentrations.
- Salinity
- .5-30PPT Brackish
- >30 Saltwater